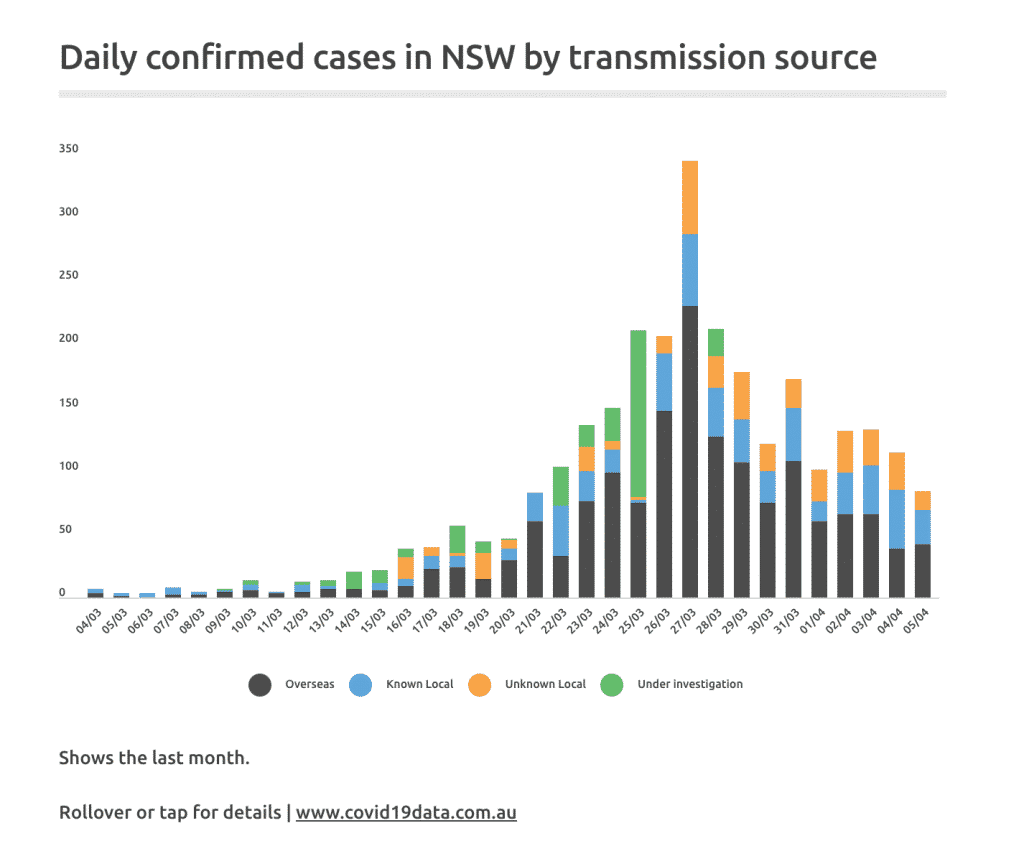
In the last week we have seen a reduction in the number of new cases of covid-19 in NSW and Victoria. However, much of that has been driven by a decision to stop importing large numbers of cases on cruise ships and aeroplanes. The graph below tracks the number of new locally acquired (or under investigation) cases of covid19 each day in New South Wales and Victoria.

Going forward, I’ll be tracking the above graph (using data from https://www.covid19data.com.au/transmission-sources) in order to assess how well social distancing is working.
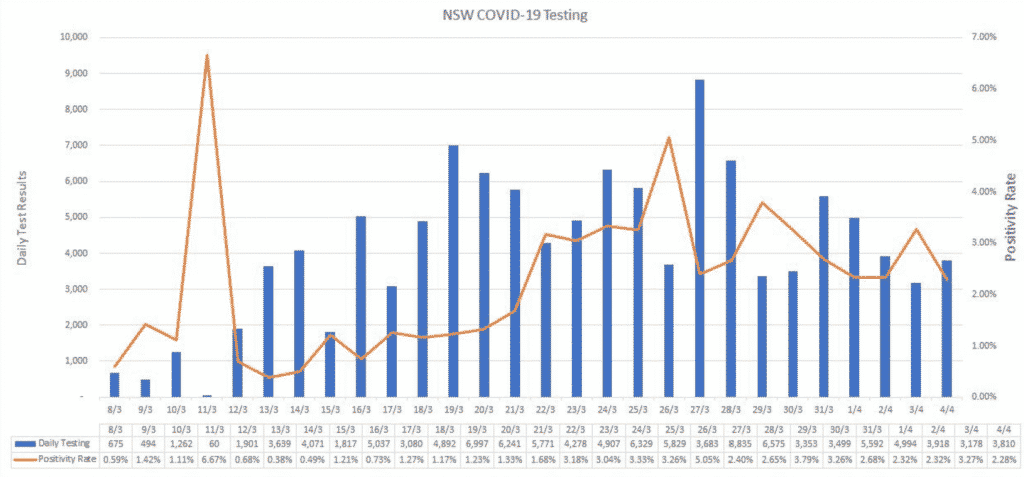
In order to understand how accurate our testing regime is, it’s worth comparing the number of new cases in NSW with the number of tests performed in NSW.

Above you can see the number of new cases each day confirmed in NSW. Below, you can see the number of tests performed in NSW each day, as well as the percentage that are positive. Thanks to Nick Fabrio for the chart.

As you can see, we’re doing significantly fewer tests per day in the beginning of April than we did at the end of March.
I’m not sure why that is, but it may be because we have no large scale program of testing, and tend to only test people who come from a high risk setting (such as working in healthcare or, not even joking, living in Waverley LGA or another infection hot spot.) If you don’t come from a high risk setting, then you need to be hospitalised with a fever (≥38°C)1 and acute respiratory symptoms.
Therefore, we are missing asymptomatic cases and cases where the patient is not badly impacted.
So, Is Social Distancing Working?
It is simply too early to say whether social distancing is working to prevent local transmission in Australia. Citizens should be wary of people who claim that a lowering rate of infection is evidence of the efficacy of social distancing when it is far more likely to reflect fewer imported cases and less testing.