When I wrote about LaserBond (ASX:LBL) on July 14th for A Rich Life here, the share price was around 37 cents. At that time, I asked whether the market was undervaluing the business. I also pointed out that there were signs management had started to focus more on execution, which could restore management’s credibility and the share price.
Less than two months later, the share price has moved to above 50 cents. That is just over 35% higher than when I first raised the question.
The key reason for this re-rating is that, for the first time in a long while, LaserBond management not only met but actually beat the guidance they had provided for H2 FY 2025. Alongside this, there are more signals of a shift in management discipline, which I will discuss in detail later.
This naturally leads to the next question: what now? After the FY25 performance, is the share price still low? To answer this, I will start with the changes you cannot capture in a spreadsheet, but can sense through management decisions. I believe there has been a noticeable improvement in management’s decisions lately. From there, I will move into the FY25 financial performance to see how the company executed, before finishing with my overall views.
In my earlier article I explained LaserBond’s business model and gave a detailed breakdown of its three divisions: Services, Products and Technology. Rather than repeating all of that background here, I suggest readers go back to that piece for the full picture of how the divisions fit together. You can read it here.
In this article, I will focus on how those divisions performed in FY25 and what the numbers reveal about the company’s progress.
Leadership is changing at LaserBond
Alongside releasing its FY25 financial results, LaserBond announced that Wayne Hooper will step down as CEO in September, with Rob Freeman set to take over. Freeman brings decades of experience in industrial and manufacturing businesses, including leadership roles at Sime Darby and Shell. Wayne will remain with the company as an Executive Director in an advisory role, which will help ensure continuity during the transition.
In my view this change is positive. In fact, it reduces key person risk and shows that succession planning has been taken seriously. Rob’s background appears well suited to guiding LaserBond through its next stage of growth, while Wayne’s ongoing presence should allow for a smooth and well supported handover.
But what strikes me most is not just the change in nameplates but the noticeable shift in management conduct. Several decisions mark a different style:
- Guidance discipline. For the first time in a long time, LaserBond actually beat its given guidance for the second half of FY25. Historically, guidance often leaned optimistic and delivery fell short. This feels like a cultural pivot.
- Strategic restraint. US expansion has been shelved. Management is focusing on domestic execution.
- No forward guidance. The FY25 results did not include formal FY26 guidance.
- Capital discipline. The Dividend Reinvestment Plan discount of five percent has been removed to avoid unnecessary dilution. This is a very small but important signal in my mind.
- Operational efficiency. The second half showed marked improvement in gross, earnings before interest, tax, depreciation, and amortisation (EBITDA) and net margins. Clearly, investments in processes and people over the past two years are now paying off.
These shifts, subtle but important, suggest a change in style. Less about grand promises, more about delivery and discipline. That may be the most important development for long term shareholders.
Laserbond FY 2025 Financial Performance
Laserbond Revenue Trends
The following chart shows LaserBond’s total revenue trend over the past decade, reaching $23.2m in H2 FY 2025. Growth is not perfectly linear, but highlights the company’s ability to expand across cycles.

When broken down by segment (as shown in the chart below), Product sales recovered in H2 FY 2025, suggesting the earlier weakness could be temporary issues rather than a structural decline. The Services division, as usual, remained solid, showing the resilience of the repair and surface engineering business. The Technology division is negligible for H2 FY 2025, but it’s an area to watch as it has already lined up higher revenue in FY26 compared to FY25. This adds an additional growth lever outside of the traditional Services and Products divisions.

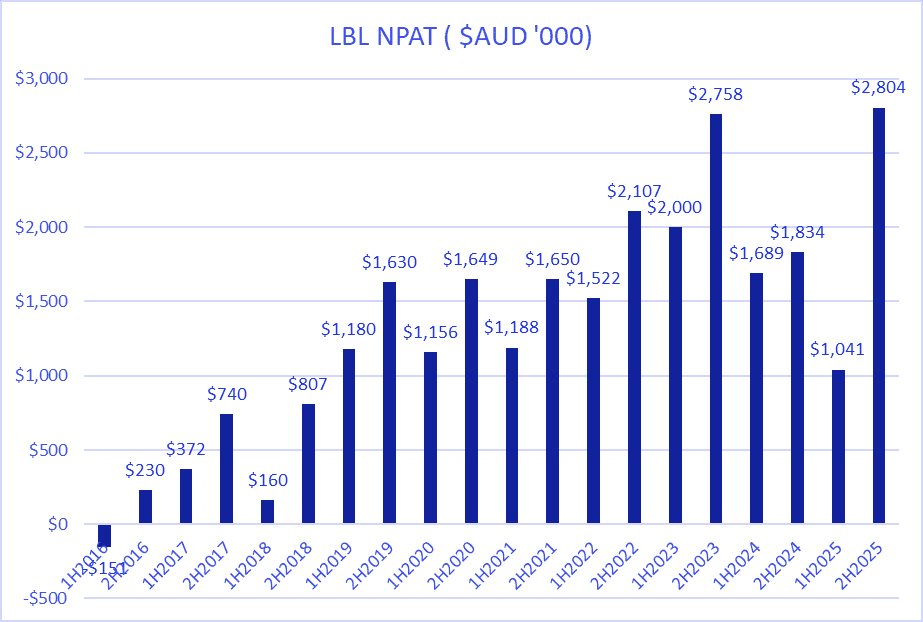
Laserbond Profit Result
EBITDA trends show that Services have become the main driver of profitability, while Products and Technology remain more volatile and occasional losses with technology segments.

Net profit after tax (NPAT) has steadily improved over the past decade, though with some volatility linked to Product and Technology division swings. LaserBond achieved $2.8 million in NPAT in the second half, highlighting the strongest run rate in the company’s history.
What Can We Learn From Laserbond’s Profit Margins?
Margins tell the bigger story. In the second half, gross margin, EBITDA margin and net margin all improved compared to the first half. This is where the company’s prior investment in new hires and systems is starting to pay off. The improved efficiency is visible not only in the numbers but also in how the business is now run day to day for example All of LaserBond’s facilities across NSW, Queensland, South Australia and Victoria achieved record months of production output during the second half. This was supported by higher capacity utilisation and the contribution of recently onboarded skilled staff, who are now fully productive across multiple shifts.
I believe (Growthgauge here) that these operational gains are a clear sign that the company is moving from an investment phase into a period of efficiency and delivery.

Outlook and my view
LaserBond looks better positioned today than it has for a long time. There are several reasons behind this improvement.
The heavy investment phase appears to be over. The new people, equipment, and systems that weighed on margins in the past are now in place, and we are beginning to see the benefits of that spending. This is showing up in early signs of stronger margins, especially in the second half of FY25.
Management also seems to have learned an important lesson. Instead of setting big aspirational targets or talking too much about opportunities years away, they have taken a more disciplined approach.They also avoided giving formal guidance for FY26, preferring to let results speak for themselves, which is a refreshing change from past practice
The problems in the Products division appear to be temporary. The second half rebound shows that customer demand is still there, and that the first half weakness could be more about timing and disruptions than a sign of long-term decline.
The Technology division, which has long been a promise rather than a contributor, now has signed deals that will deliver more revenue in FY26 than in FY25. That gives the business a clearer growth path in this higher-margin segment.
Gateway is another important piece. LaserBond owns 40 percent today, but within the next two years that stake will likely rise above 50 percent. Once that happens, Gateway’s revenue will be consolidated into LaserBond’s accounts, which will make reported revenue growth look much stronger.
In the short term, the next result, being the first half of FY26, will be important. It will be compared against a very weak first half of FY25, so the numbers should show strong year-on-year growth. More importantly, that result will also give us an early read on whether the improved run rate from the second half of FY25 is sustainable.
In my opinion, LaserBond is quietly entering a more disciplined and potentially more rewarding phase.
Laserbond Stock Valuation
With about 118 million shares on issue and a share price of 51 cents, LaserBond’s market capitalisation now sits close to $60 million.
For FY 2025 the company delivered NPAT of $3.8 million, which implies a trailing P/E multiple of roughly 16x. That does not look stretched compared to many small-cap industrial peers, especially when you factor in the strong second-half recovery.
If we assume Laserbond can maintain the second half run rate in FY 2026, NPAT could reach somewhere around to $5.5 million to $6 million. On that basis, the forward P/E would fall towards 10x to 11x.
Still, this is not without risk. Customer concentration remains the key question mark. The Products division continues to rely heavily on just a couple of large OEMs. Any change in ordering patterns, as seen in the first half of FY25, can make results lumpy. Another swing like that could quickly dent confidence.
There are also questions around how quickly the Technology division can build real recurring revenue from modular cladding cells and licensing deals. FY25 showed the first real signs of traction in a very long time, so it would be silly to assume success here (though it may be possible one day).
Key questions for investors from here include:
- Can the Products division keep OEM orders stable and expand its customer base?
- Will the Services division continue to deliver high growth now that investment in capacity is behind it?
- Overall, can Laserbond continue with FY 2025 second half’s margin trends?
How you answer these questions will determine whether you think LaserBond’s current valuation is fair, or whether the company still offers value after the recent share price run.
NOTE: I did not attend the investor call for the FY25 results, so I may have missed any additional details shared there. If a recording becomes available and I come across anything noteworthy, I will add it in the future.
Do you monitor a watchlist of stocks? You can use InvestorPA to get instant email alerts for every ASX announcement (for the stocks you select).
Join The Waitlist To Become A Supporter, And Receive Our Free Special Report Directly To Your Inbox
Disclosure: The author of this article owns shares in LBL. The editors of this article, Claude Walker and Patrick Poke, do not own shares in LBL. They will trade LBL shares for at least 2 days following the publication of this article. This article is not intended to form the basis of an investment decision and is not a recommendation. Any statements that are advice under the law are general advice only. The author has not considered your investment objectives or personal situation. Any advice is authorised by Claude Walker (AR 1297632), Authorised Representative of Ethical Investment Advisers Pty Ltd (ABN 26108175819) (AFSL 276544).
The information contained in this report is not intended as and shall not be understood or construed as personal financial product advice. You should consider whether the advice is suitable for you and your personal circumstances. Before you make any decision about whether to acquire a certain product, you should obtain and read the relevant product disclosure statement. Nothing in this report should be understood as a solicitation or recommendation to buy or sell any financial products. A Rich Life does not warrant or represent that the information, opinions or conclusions contained in this report are accurate, reliable, complete or current. Future results may materially vary from such opinions, forecasts, projections or forward looking statements. You should be aware that any references to past performance does not indicate or guarantee future performance.