Data#3 Limited (ASX: DTL) continues to ride the big digital wave, helping more enterprise clients solve complex business issues by providing innovative technology solutions. In the FY 2022 Data#3 results, revenue grew by 12.1% to $2.19 billion and net profit after tax improved by 19.4% to $30.26 million, enabling the ASX-listed tech solutions distributor to declare a final dividend of 10.65 cents per share.
The tech solutions and distributor is proving to be a sound dividend play as the final dividend brings the total fully franked dividend for FY22 to 17.90 cents per share. This represents a 19.3% higher dividend than FY21. You can see our past coverage of Data #3 here.
Is Data#3 chasing valuable growth?
As depicted below, Data#3 continues to execute on locking in consistent revenue growth by focusing on lifting recurring revenue from cross-selling additional services to customers over long-term contracts.

The technology solutions and product distributor noted its four key vendors; Cisco, Dell, HP and Microsoft all experienced record demand.
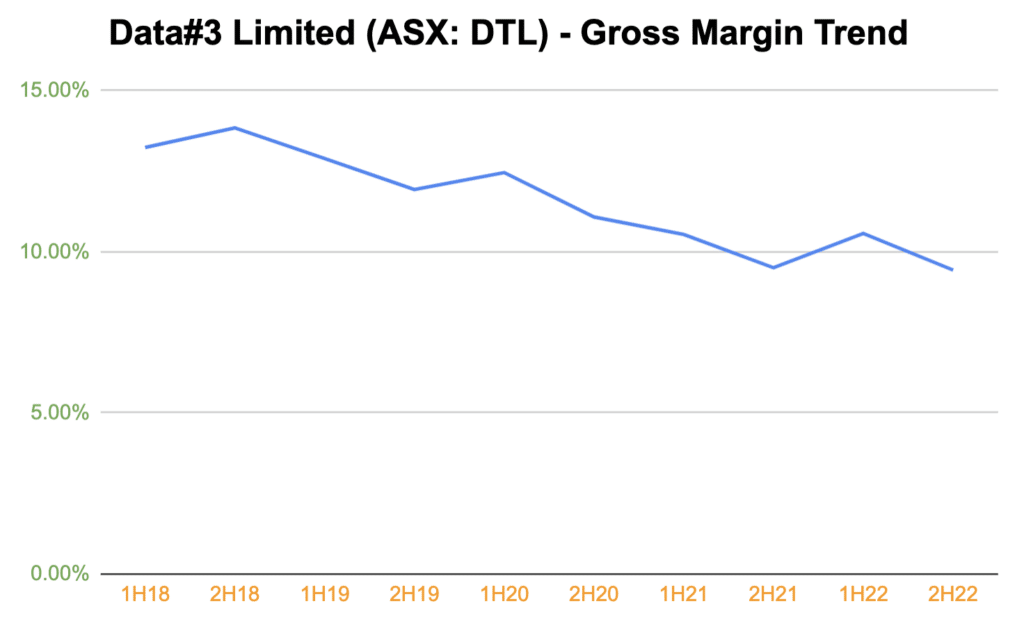
In these Data#3 results, revenue growth was primarily fuelled by solid momentum in public cloud revenues. However, Data#3’s biggest revenue driver, software solutions (licensing and cloud subscription services) is compressing its gross margins. Between 2012 and 2017, the gross margin hovered from 14.3% to 15.9%. Data#3 reached a peak of 15.9% in 2013.
In the following half-decade, its gross margin has taken a downward turn as shown below.

When management was questioned about this downward trend, they advised this was due to the change in revenue mix as the company generated more revenue from services. CFO Brem Hill added that even though the company recorded much higher growth in services revenue, a lot of this pertained to maintenance services, which is lower margin than managed services.
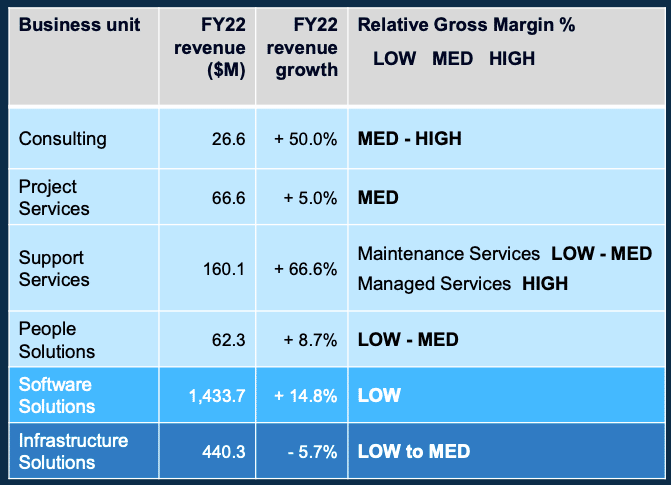
To management’s credit, they provided the following margin levels for each revenue segment.

Whilst the table provides a tremendous relative overview, it would be even better if management could outline the breakdown of the gross margins between products and services.
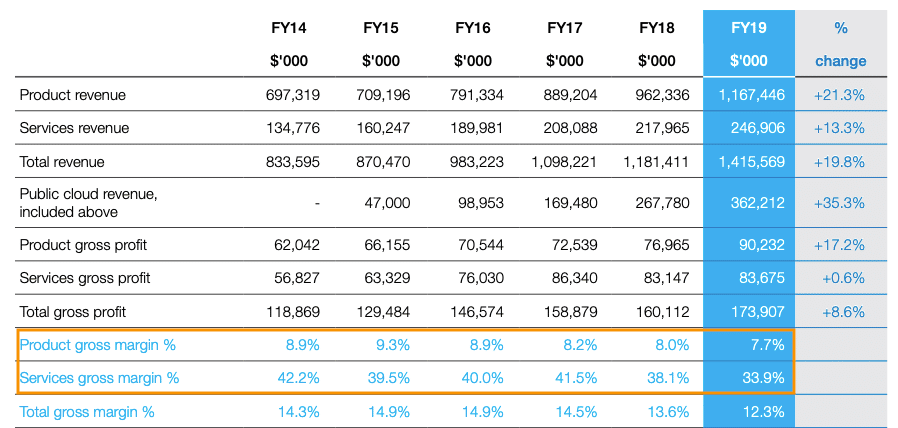
It’s interesting to see that management has previously disclosed the gross profit margins on a product and services level, up to the FY19 Data#3 results.

Compare this to the FY20 annual report below.

For some reason, they have changed the look of this table from the FY 2020 Data#3 results, and I find it a bit odd. Perhaps the downward trend would leave slight stains on otherwise strong sets of results.
When management was asked about further details on the breakdown of the gross profit margins for the segments, they advised that this information isn’t disclosed for the purposes of competitor reasons.
This may be big cloud services and software providers are flexing their muscles in negotiating wholesale prices or it could be large customers negotiating harder for lower prices. Data#3 is always going to have lower margin than software companies given it’s just a distributor albeit a dominant one in Australia.
I would need to conduct more scuttlebutt research to get a better understanding of these dynamics, so feel free to be in touch if you work in the industry!
If Data#3 is indeed being squeezed from vendors and/or customers, then close attention should be paid to the impact of lower gross margins on cash levels. For Data3# to be able to keep being a sound dividend play, it needs to keep generating adequate free cash flow. This leads to my other point I want to raise as it recorded negative free cash flow again.
Free cash flow in FY 2022 Data#3 Results
Data#3 again recorded negative operating cash flow of $22.62 million, which is not much different from FY21. FCF came in at negative $26 million, similar to FY21.
Management noted, “Underlying ‘free cash’ is typically $15M – $20M but has been reduced in FY22 due to inflated inventory position at year-end. This is expected to normalise in 1H FY23 as the backlog unwinds.”
This makes sense and if we look at the incremental increase in accounts receivable of around $112 million and a jump of around $62 million in accounts payable, we can see a significant difference. This also explains why FCF isn’t as high as it should be due to a greater build up of invoiced work yet to be paid.
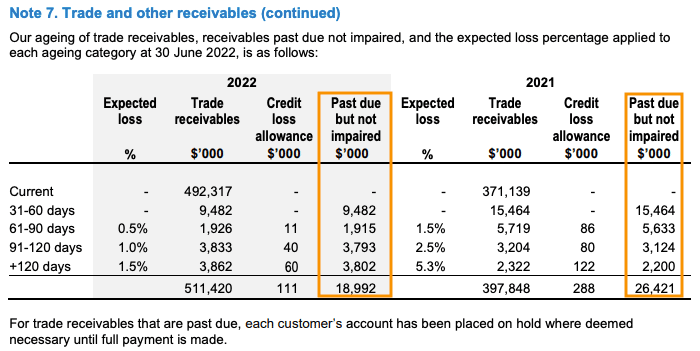
It’s encouraging to see a reduction in the trade valuables that are past due but not impaired.

Data#3 still possesses a cash war chest of around $149 million, which is down from $204 million in FY21. Whilst it’s great to see Data#3 paying higher dividends, it cannot keep on using existing cash because eventually, this will run out if core operations continue to burn cash.
The biggest cost for Data#3 lies in the purchase of the products from the vendors. Further, the rise in wages along with a growing shortage in labour supply, in particular within the technology space, could add further pressure on FCF. Classically, capital intensive businesses fare worse in an inflationary environment and Data#3 is one such business.
There is still a lot to like about Data#3. The business is currently debt free with significant cash, is operating in a structurally growing industry and is run by a very experienced management team with a proven record. However, it is not the highest quality business since it has low net profit margins of just 1.38% and is capital intensive. This is certainly not ideal in the current inflationary environment, but at least it has demand tailwinds, for now.
Did you find this article useful? Sign up to receive access to hidden, Free content like this!
Disclosure: the author does not own shares in DTL and will not trade for 2 days following this article. This article is not intended to form the basis of an investment decision. Any statements that are advice under the law are general advice only. The author has not considered your investment objectives or personal situation. Any advice is authorised by Claude Walker (AR 1297632), Authorised Representative of Equity Story Pty Ltd (ABN 94 127 714 998) (AFSL 343937).
The information contained in this report is not intended as and shall not be understood or construed as personal financial product advice. You should consider whether the advice is suitable for you and your personal circumstances. Before you make any decision about whether to acquire a certain product, you should obtain and read the relevant product disclosure statement. Nothing in this report should be understood as a solicitation or recommendation to buy or sell any financial products. A Rich Life does not warrant or represent that the information, opinions or conclusions contained in this report are accurate, reliable, complete or current. Future results may materially vary from such opinions, forecasts, projections or forward looking statements. You should be aware that any references to past performance does not indicate or guarantee future performance.