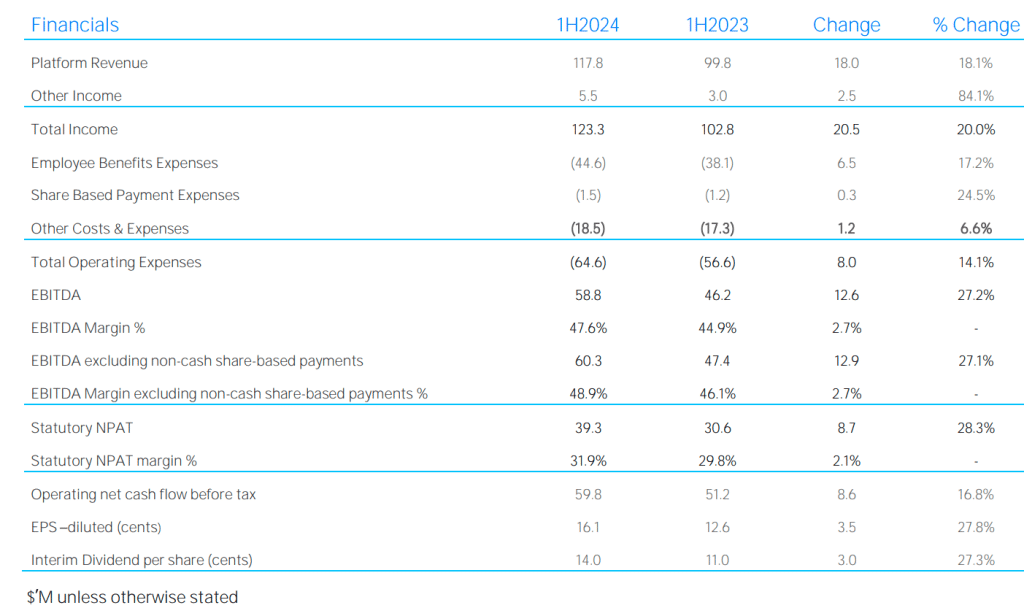
Wealth platform provider Netwealth (ASX: NWL) produced a strong turnaround in its 1H FY 2024 results after challenging market conditions in FY 2023. Revenue grew 18% to $123.3m and net profit jumped 28% to $39.3m relative to 1H FY 2023. A record 20% growth rate in new financial intermediaries helped boost funds under administration (FUA) and improved market conditions spurred higher trading volumes, resulting in greater ancillary and transaction fees earned.

Source: Netwealth 1H FY 2024 Results
Total expenses rose 14% to $64.6m, mainly due to additional staff for technology and other key operations. On the earnings call, Netwealth CFO Grant Boyle flagged that headcount will be slightly lower in the second half. Net operating cash flows increased from $37.9m in 1H FY 2023 to $40.6m in 1H FY 2024 and cash used for investing was slightly lower. The Netwealth cash balance lifted by $6m to $115.7m and there is no debt. The board declared a fully franked interim dividend of 14 cents per share, payable on 28 March 2024.
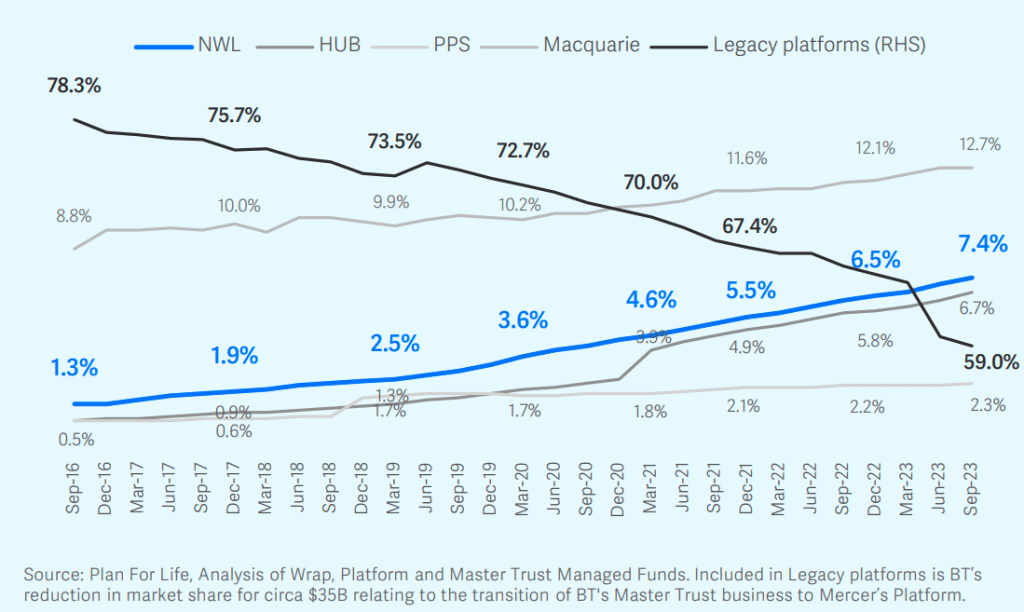
Netwealth along with its rivals HUB24 Limited (ASX: HUB) and Macquarie (ASX: MQG) continue to take market share from legacy platforms as advisers switch for greater independence and better functionalities. The fall in market share of the incumbents has accelerated in the past year as seen below.

Source: Netwealth 1H FY 2024 Results Presentation
Whilst Netwealth and HUB are capturing market share swiftly, their share prices already assume that will happen.
Lofty Expectations
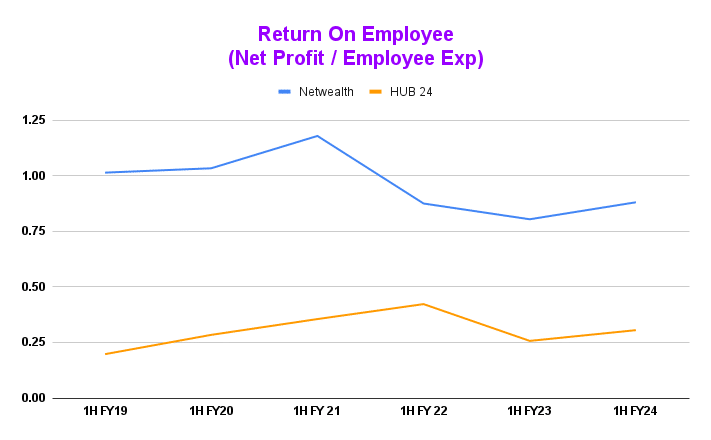
Netwealth and HUB catapulted to ASX growth stock stardom after the Royal Commission into the financial advisory industry. Such rare events meant Netwealth and HUB were able to easily take market share from the vertically integrated competitors. As you can see below, net profit earned on every dollar of employee costs peaked in 1H FY 2021 for Netwealth and 1H FY 2022 for HUB.
I view employees as the key denominator of the wealth platform business because they are the biggest revenue-generating assets and also the largest operating cost. In particular, distribution staff are responsible for attracting financial advisers and ultimately fund flows and software developers ensure advisers are equipped with the best tools to serve their clients.

Source: Netwealth & HUB HY Reports
Record results often create high expectations, but market flows are more cyclical. Netwealth and HUB were unable to replicate their past growth in FY 2023, hampering expectations and leading to a lower multiple. The Netwealth forward PE multiple steadily declined from the mid-60s to as low as the mid-30s in October 2023. Since posting stronger growth in FY 2023, the forward PE has rebounded to sit at around 46x, which is not far from the five-year average of 50x. Business performance dictates expectations.
It’s unlikely regulatory changes like the Royal Commission will repeat but investors are excited again by the pick up in recent growth. The promise of more of the same seems to be fuelling the step change in the forward PE multiple. Hence the lift in the share prices of Netwealth and HUB yesterday.
Organic vs Acquisitive Growth
Netwealth has focussed on organic growth whilst HUB has been on an acquisition spree. Since FY 2020, HUB has acquired four businesses at the expense of around $460m in capital with the biggest play being its takeover of Class for around $340m. Before these takeovers, HUB generated $74m in revenue and $8m of net profit in FY 2020 with $33m of cash.
When taking into account these numbers, the acquisitions were quite large. Fund manager Aoris conducted a fascinating study of the largest 1,000 merger and acquisition deals by transaction value in the last 50 years and found acquisitions are more likely to fail when they are meaningful relative to the acquirer’s size. And those businesses that consistently sought out small bolt-on acquisitions that complemented the acquirer’s core strategy were more durable and resilient.
If we zoom in on revenue per employee and employee expenditure per employee below, it seems Netwealth is better on that score, though they are quite close. Notably, revenue per employee for HUB is trending down as a result of all the additional staff from the acquisitions.

Source: Figures from reports and investor presentations
It seems the acquisitions have also brought about growing administrative costs for HUB, which are much higher than that of Netwealth. If Netwealth’s bid for competitor Praemium (ASX: PPS) had not fallen through in November 2021, Netwealth may well have followed a similar path given the offer valued Praemium at around $785m at an offer of $1.50 per share. Since then, the Praemium share price has been cut by more than a third to now $0.41 per share. Perhaps that is the one we should be looking at.
That said, I’m still holding on to my Netwealth shares as the number of financial advisers continues to fall. I believe this presents a material tailwind over the long term as a shrinking pool of advisers becomes more reliant on platform tools to deal with the growing demand for financial advice, while each adviser should bring more funds onto the plaform. I just hope Netwealth continues its conservative capital allocation approach and focuses on organic profitable growth.
Disclosure: the author of this article owns shares in NWL. The editor does not own shares in NWL but the editor does hold shares in HUB. The author and editor will not trade in these shares for at least 2 days following the publication of this article. This article is not intended to form the basis of an investment decision and is not a recommendation. Any statements that are advice under the law are general advice only. The author has not considered your investment objectives or personal situation. Any advice is authorised by Claude Walker (AR 1297632), Authorised Representative of Equity Story Pty Ltd (ABN 94 127 714 998) (AFSL 343937).
The information contained in this report is not intended as and shall not be understood or construed as personal financial product advice. You should consider whether the advice is suitable for you and your personal circumstances. Before you make any decision about whether to acquire a certain product, you should obtain and read the relevant product disclosure statement. Nothing in this report should be understood as a solicitation or recommendation to buy or sell any financial products. A Rich Life does not warrant or represent that the information, opinions or conclusions contained in this report are accurate, reliable, complete or current. Future results may materially vary from such opinions, forecasts, projections or forward looking statements. You should be aware that any references to past performance does not indicate or guarantee future performance.